Tracing Skia Execution
Introduction
Skia is instrumented to provide execution traces in several ways. Within Chrome, Skia is traced with the standard tracing interface, along with the rest of Chromium. In the Android framework, Skia’s tracing is integrated into atrace.
For standalone builds, Skia’s tools (DM, nanobench, and Viewer) are capable of tracing execution
in three ways, controlled by the --trace command line argument.
Standalone Tracing
Most arguments to --trace will be interpreted as a filename (the two exceptions are described
below), and trace events will be written to that file in JSON format, suitable for viewing with
chrome://tracing.
# Run DM on several GMs to get tracing data
out/Release/dm --config gl --match bleed --trace gl_bleed_gms.json
This creates a file gl_bleed_gms.json in the current directory. There are limitations in Chrome’s
tracing tool that prevent loading a file larger than 256 MB. To stay under that limit (and avoid
clutter and slowdown in the interface), it’s best to run a small number of tests/benchmarks when
tracing. Once you have generated a file in this way, go to
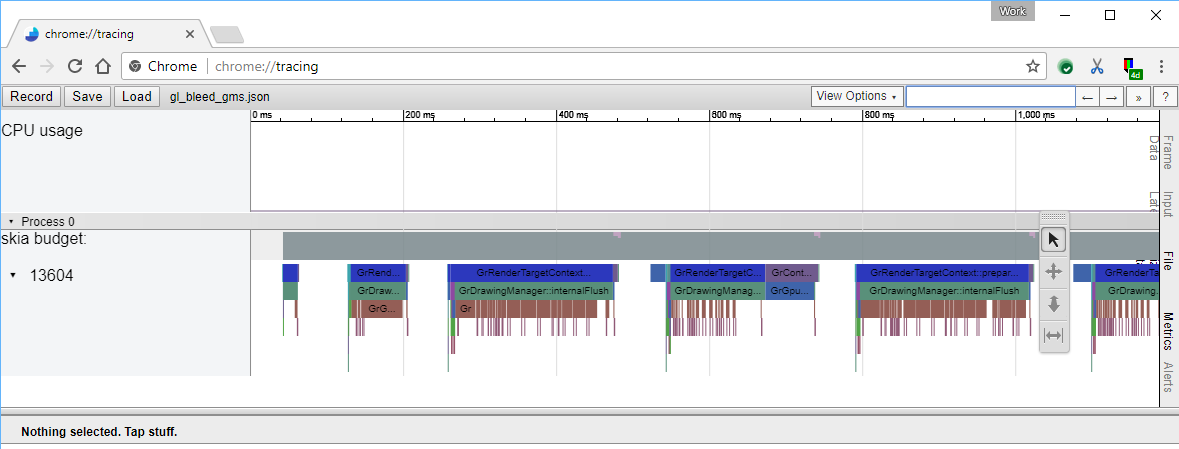
chrome://tracing, click Load:
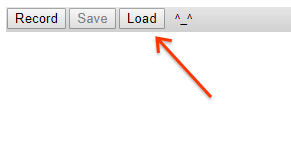
… then select the JSON file. The data will be loaded and can be navigated/inspected using the tracing tools. Tip: press ‘?’ for a help screen explaining the available keyboard and mouse controls.
Android ATrace
Running any tool with --trace atrace on an Android device will cause the application to forward
tracing information to atrace. On other
platforms, this has no effect.
If you run systrace from the host command line, you will need to supply -a <app_name>,
and the <app_name> argument will need to exactly match the command line used on the target
device. For example, if you use adb shell "cd /data/local/tmp; ./nanobench --trace atrace ..."
you must pass -a ./nanobench or systrace will ignore events from the application.
Console Logging
For simple situations, all tracing events can be directed to the console with --trace debugf:
# Run DM on a single GM with SkDebugf tracing
out/Release/dm --config gl --match ^gamma$ --trace debugf
[ 0] <skia.gpu> GrDrawingManager::internalFlush id=1 #0 {
[ 0] } GrDrawingManager::internalFlush
[ 0] <skia.gpu> GrGpu::createTexture id=1 #1 {
[ 0] } GrGpu::createTexture
[ 0] <skia.gpu> GrRenderTargetContext::discard id=1 #2 {
[ 0] } GrRenderTargetContext::discard
[ 0] <skia.gpu> SkGpuDevice::clearAll id=1 #3 {
[ 1]  <skia.gpu> GrRenderTargetContext::clear id=1 #4 {
[ 1]  } GrRenderTargetContext::clear
[ 0] } SkGpuDevice::clearAll
[ 0] <skia> SkCanvas::drawRect() #5 {
[ 1]  <skia.gpu> SkGpuDevice::drawRect id=1 #6 {
[ 2]   <skia.gpu> GrRenderTargetContext::drawRect id=1 #7 {
[ 3]    <skia.gpu> GrRenderTargetContext::addDrawOp id=1 #8 {
[ 3]    } GrRenderTargetContext::addDrawOp
[ 2]   } GrRenderTargetContext::drawRect
[ 1]  } SkGpuDevice::drawRect
[ 0] } SkCanvas::drawRect()
...
Tracing with Perfetto
Running any tool with --trace perfetto will cause the application to forward
tracing information to Perfetto.
Perfetto only supports Linux, Mac, and Android and will not run on other platforms.
By default, Perfetto tracing within Skia has been configured to handle relatively short
(~10 seconds or less) trace events and sessions (for example, a subset of tests rather than the
entire testing suite). For any tracing sessions longer than ~10 seconds, it is recommended to use the --longPerfettoTrace runtime option which will change Skia’s Perfetto configuration to accommodate
the longer trace. Long traces conducted without this runtime option run the risk of overwriting
events, leading to a loss of data.
The trace output file path can be changed with runtime arguments. --perfettoOutputDir sets the
output directory, --perfettoOutputFileName sets the output file name (without file extension),
and --perfettoOutputFileExtension sets the output file extension. By default, the trace file will
be placed in the build output directory as trace.perfetto-trace.
You can also elect to generate different trace files for each nanobench benchmark. To do so, use
the
--splitPerfettoTracesByBenchmark option. Note that this will lead to the output files being
named after the different benchmarks.
These trace files can be visualized using Perfetto’s web visualization tool. To visualize larger trace files (anything greater than around 2 GB), see these instructions.
Should you run into any issues or unexpected results, Perfetto has some resources which may help. To identify potential root causes, check the “Info and stats” page on the web visualization tool, or by running SQL queries on the trace file (online, or by using the trace processor application). To diagnose these issues, see this section on debugging data losses and this section on out-of-order events which may appear unexpectedly long.
Adding More Trace Events
Adding more trace events involves using a set of TRACE_ macros. The simplest example, to record
the time spent in a function or other scope, is:
#include "SkTraceEvent.h"
...
void doSomething() {
  // Add an event for the duration of the current function (or other scope)
  // "skia" is a category name, for filtering events while recording
  // TRACE_FUNC is the event name, and expands to the name of the current function
  TRACE_EVENT0("skia", TRACE_FUNC);

  if (doExtraWork) {
    TRACE_EVENT0("skia", "ExtraWorkBeingDone");
    ...
  }
}
For more examples, including other kinds of trace events and attaching parameters to events, see the comments in SkTraceEventCommon.h.