Debugging DM on Android
By default, we don’t do Android builds with full symbols. Assuming you want more than callstacks, add the following to your GN args:
extra_cflags = [ "-g" ]
When you build, you need to have built the gdbserver target. Either build everything, or at least
build both dm and gdbserver:
ninja -C out/android dm gdbserver
At this point, the Android gdb script should work. Try running:
platform_tools/android/bin/android_gdb_native -C out/android dm -i /data/local/tmp/resources <args>
You will end up in a command-line gdb session connected to dm on the device. You’re done, but you can do better. From here, I’m assuming that you use VS Code. I strongly suspect that this could be adapted to other IDEs' GDB integration.
VS Code comes with lldb support, but this workflow needs a GDB extension. Search for ‘Native Debug’ in the extension browser and install it, the thing you want comes from https://github.com/WebFreak001/code-debug if you’re unsure.
In your VS Code project’s launch.json, add an entry that looks like the following. You’ll need to
replace <NDK_BUNDLE> with the path to your NDK bundle (ie $ANDROID_NDK_HOME):
{
    "name": "Android GDB",
    "type": "gdb",
    "request": "attach",
    "target": ":5039",
    "remote": true,
    "gdbpath": "<NDK bundle>/prebuilt/linux-x86_64/bin/gdb",
    "executable": "out/android/android_gdb_tmp/dm",
    "cwd": "${workspaceRoot}",
    "autorun": [ "break main" ]
}
Rather than running android_gdb_native, run android_gdbserver in the same directory (and with
the same arguments). This will do all of the same deployment, and run gdbserver on the device,
but won’t start command line gdb on your host.
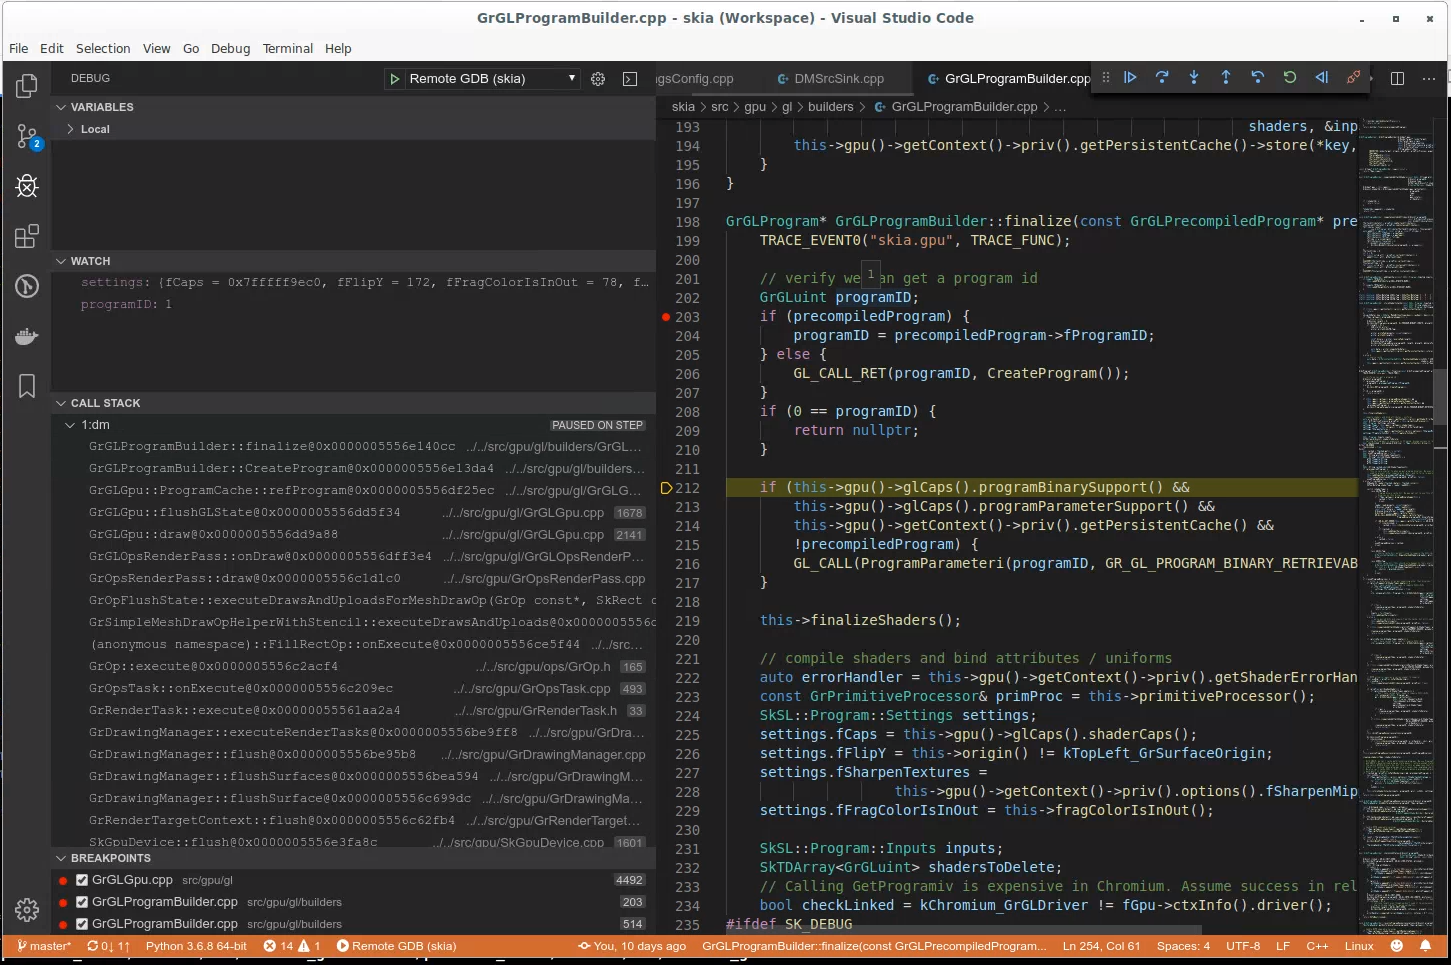
Now, just ‘Start Debugging’ in VS Code (with the new configuration selected, if you have more than one). The VSC hosted gdb will connect to gdbserver, and you’ll have a somewhat interactive debugger where you can set breakpoints in your source windows, have panes for watches, locals, and the call stack, etc. Enjoy: